
Visualisation of the location data
Visualisation of the location data
A launch of v0.1 (sort of) of Lokasi data API

Just to update.
Please find the links to the visualisation for the housing projects and the buildings to get a feel of what it is going to look like. For now, we are using tableau as the visual tool.
1. Housing projects
https://public.tableau.com/profile/erhan.azrai#!/vizhome/DistributionofHousingProjects/Sheet1

For this data, we have 5500+ projects with a long list of variables but some are requires more work to fill up the gaps.
2. Office Building https://public.tableau.com/profile/erhan.azrai#!/vizhome/Commercial_16073946856050/Sheet1
These are roughly 300 buildings in Kuala Lumpur.
3. Point of Interest (POIs) https://public.tableau.com/profile/erhan.azrai#!/vizhome/POI_16074052590830/Sheet3
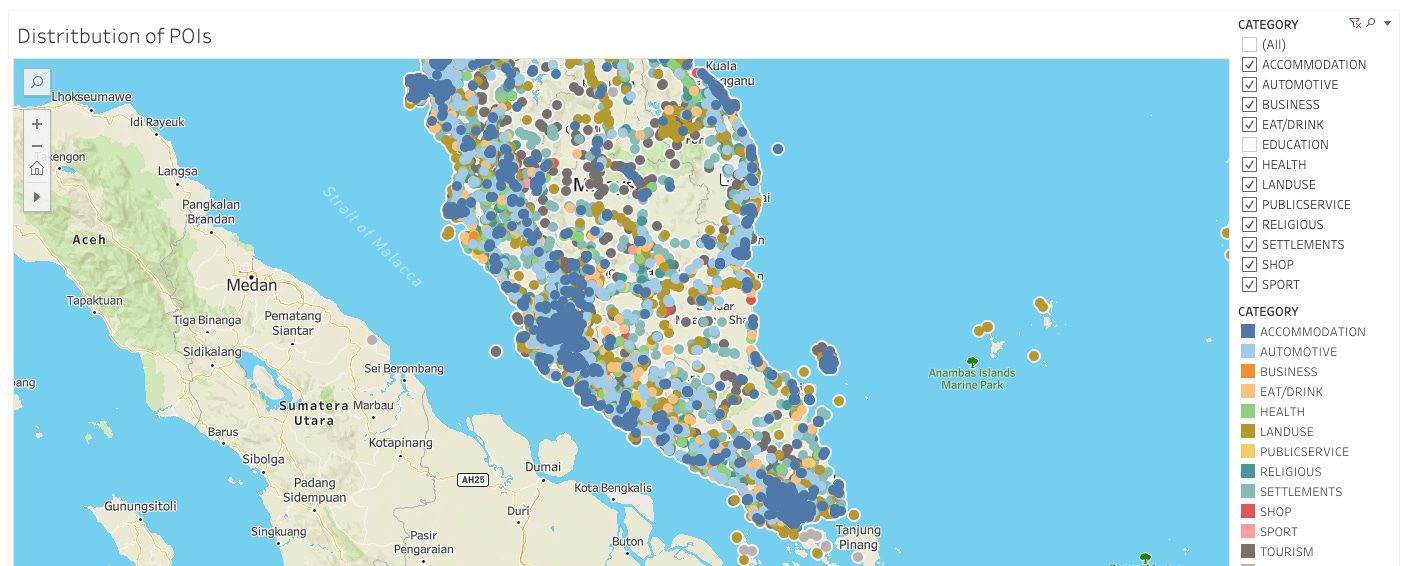
We also have about 100k of POI distributed across the country that we can do calculations on together with housing and office dataset. We are working with another company, Vase.ai to enrich this dataset.
For now, we keep the data sections separate and we are still fine-tuning the user interface (UI) for public.
Let me know or leave a comment below. Thanks.
If you would like to receive further updates, please subscribe.